
Jim Doti on Housing Affordability and the California Economy
James Doti joined the faculty of Chapman University (then Chapman College) in 1974, founded the Anderson Center for Economic Research in 1978, and served as President of the university from 1991-2016, continuing as a faculty member, President Emeritus and Donald Bren Distinguished Chair of Business & Economics. It was under his watch that Chapman went from a small local college to an educational institution with national accreditations, expanding the range of internal schools on campus, increasing the faculty, student body and graduation rates.
Of great interest is a recent monthly series by Dr. Doti published in the Orange County Business Journal on housing affordability in California. Unlike much of the attention focused on affordable housing as an antidote for increased homelessness (another very worthwhile topic), Doti focuses on the economic impact of housing affordability generally, and it is a fascinating study.
He starts by looking at the ratio of home price to annual income, noting the relationship between the cost of his first home to his starting salary at Chapman in 1974 ($22,000 ÷ $12,500 = 1.8), and contrasting that to the current price of a comparable home relative to the starting salary for a new assistant professor at Chapman today ($480,000 ÷ $80,000 = 6.0).
The wide disparity between home appreciation and income growth in California is no secret, and Doti’s experience referenced above is a great example (examining this relationship prior to the housing crash in the mid-2000’s should have set off alarms about the pending housing bubble that burst in a spectacular way). He goes on to note that high home prices ultimately drive many to the rental market (which is also insanely expensive in many parts of California), and the more transient nature of renters v. homeowners makes relocation much easier, explaining the migration of large numbers of California residents to lower-cost states like Texas and Florida, a phenomenon Doti describes as people “voting with their feet” in search of a better deal.
A comparison of home prices for metropolitan areas in selected states as of 4th quarter 2016 published by BankRate.com (sourced from the National Association of Realtors) is illustrative:

Doti references California’s Silicon Valley, well-known for its stratospheric home prices (the high end of the range for California in the chart above is for San Jose-Sunnyvale-Santa Clara), as well as its concentration of high-tech companies and employment. Home price/income ratio in the Silicon Valley is almost 9.0, compared to 4.9 for the United States overall. Even for highly-paid tech workers, the 5.9 ratio of price to income Is still higher than the national average.
The predictable result is that growth of Silicon Valley’s tech employment has slowed to under 4% annually, while other established and emerging tech hubs (Seattle, Salt Lake City, Raleigh and Palm Beach) reflect growth rates from 5% to over 6% annually. And lest we focus on just the local impact of this phenomenon, Doti translates the loss of high-tech jobs in Silicon Valley to a loss of $500 million in state tax revenue.
A similar look at the housing market in Orange County indicates that median family income could afford the median-priced home in 1996, but in 2004 – only eight years later – median family income was only 50% of what was needed to buy the median-priced home. Over the same period, housing affordability in the United States stayed pretty much the same (although this probably wouldn’t apply to parts of the country that experienced comparable housing bubbles). The culprit, of course, is housing prices, which increased 235% in Orange County from 1996-2004, compared to roughly 60% nationwide over the same 8-year period; similar results were noted for other major California counties, including Los Angeles, San Diego and San Francisco.
So why did this happen? Doti cites several factors, all well intentioned government initiatives with apparently unintended consequences – the 1977 Community Reinvestment Act (including subsequent regulatory changes), the Taxpayer Relief Act of 1997 (lowering capital gains rates and raising the threshold for nontaxable gains on the sale of a principal residence), relaxed lending standards and introduction of standardized loan underwriting guidelines. The most important factor, however, would be the increased U.S. trade deficit, causing foreign demand for mortgage-backed securities to skyrocket (it was this market that imploded and led to the global financial crisis in 2007-08).
With home ownership increasing from 64% to 69% over 1996-2004 (a shift in the demand curve), prices predictably increased. Housing supply can’t normally respond quickly to such changes (in contrast to other consumer products), and this is especially true in California, with a limited supply of desirable land due to building restrictions and costly environmental regulations. So increased demand, coupled with inability to increase supply proportionately, has led to the current disparity in housing prices between California and other parts of the country.
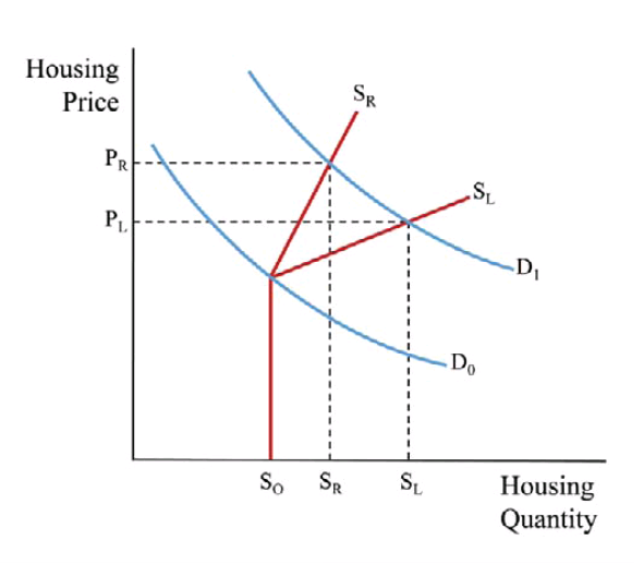
The chart below is from Doti’s column in the 5/22/17 edition of the OCBJ, with D0 and D1 reflecting the shift in the demand curve, S0 showing initial supply, and SR and SL representing supply curves in highly-regulated and less-regulated markets, respectively. The result is a higher equilibrium price in highly-regulated markets (PR) compared to less-regulated markets (PL), both of which are higher than the initial equilibrium price (intersection of D0 and S0).
Thanks again to Dr. Jim Doti for his attention to this issue, and unique economic perspective. Solutions to the problem are elusive, and the potential long-term impact on the California economy is uncertain.